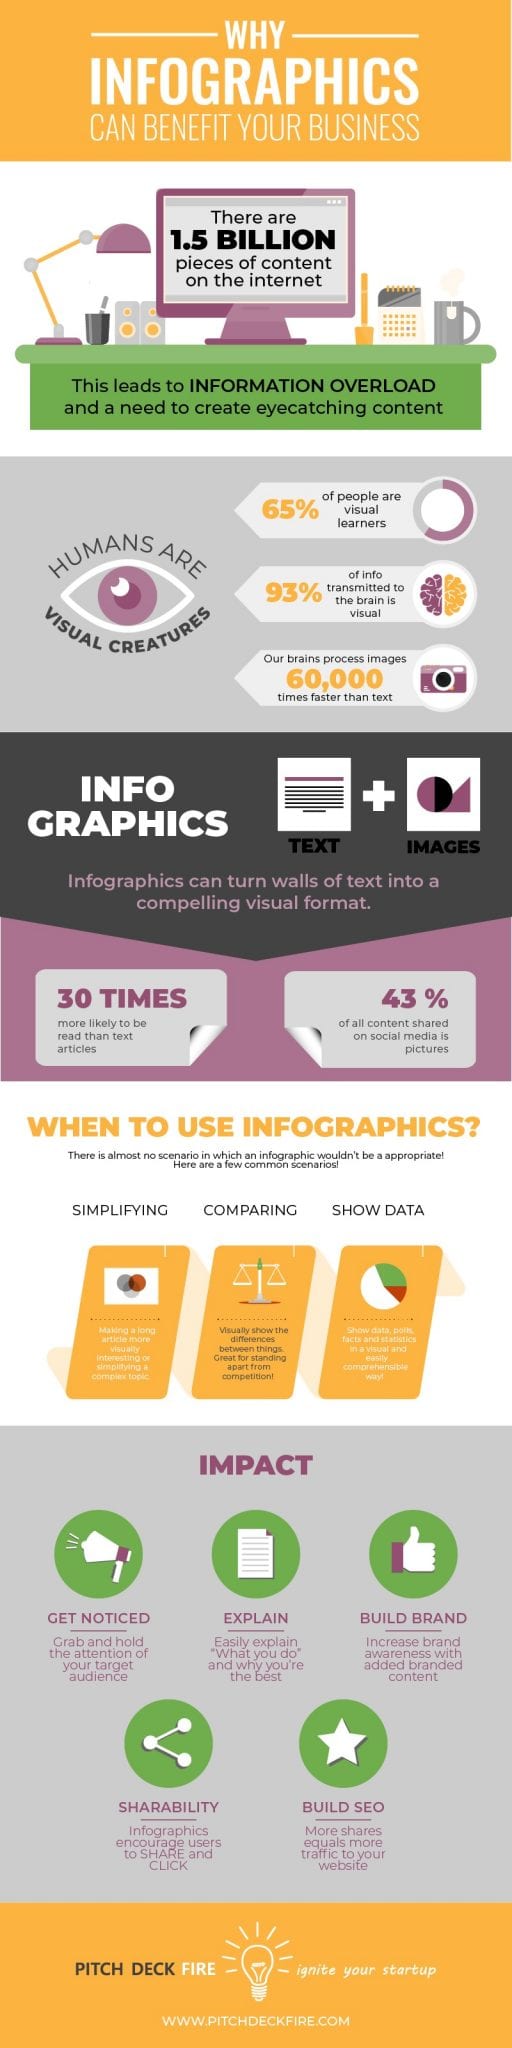
According to recent research there are over 1.5 billion individual pieces of content on the internet today, which can make it hard to stand out amongst the crowd. You may be currently “throwing words” into the abyss, generating blog after blog full of text and useful information but seeing little no no results.
While strategic text can be critical for SEO, it often gets lost in the minds of consumers. Think about the last time you went to read an article and saw pages and pages of text and thought…. “Hmm, maybe I’ll just bookmark this to read later”. The key to hooking consumers amongst the throngs of digital information is strategic visual content.
What you really need is something that will hook your target audience and immediately grab their attention, and one of the best ways to do this is through infographics.
Don’t Just Tell Your Story – Show It!
Today’s consumers are overloaded with information and need content to be visually stimulated in order to engage with your content. Humans are visual creatures with over 90% of the information that is transmitted to the brain being visual, and it is processed 60,000 times faster than text! Couple that with the fact that an estimated 65% of people are visual learners, and you can truly see the impact strategic visuals make! The brain simply processes visual information incredibly faster than text, so if you really want to make a point to your target audience an infographic could be the ultimate way.
Another bonus of visual content is social sharability. A picture is truly worth a thousand words, and by creating an amazing infographic with valuable data, you will be able to increase engagement and encourage sharing.
What are Infographics?
Infographics are put simply, visual presentations of information that use the elements of design to display content. Infographics can change walls of text and complex data into a visual format that is both easy to process and ripe for sharing.
Recent research conducted by Brooke Barnett and Barbara Miller further proves the importance of infographics:
“On their own, text and graphics are both useful yet imperfect methods for communication. Written language allows an almost infinite number of word combinations that allow deep analysis of concepts but relies heavily on the reader’s ability to process that information. Graphics may be easier for the reader to understand but are less effective in communication of abstract and complicated concepts. … combining text and graphics allows communicators to take advantage of each medium’s strengths and diminish each medium’s weaknesses.”
When to Use Infographics?
There are many instances in when using an infographic can be extremely beneficial to your business. I’ve highlighted a few of them below.
Simplifying a Complex Concept
Understanding ins and outs of legal strategy or other business topics may seem simple to you or anyone in your industry, but chances are your target audience is confused and zoned out. Infographics can help simplify a complicated idea, making it a great educational tool for your customers. Using infographics for business also employs the concept of visual hierarchy, highlighting the most important text for full comprehension.
Here is a great example of an infographic for legal contracts. Reading over an article about this may leave the reader confused, yet this well-designed infographic presents the information in a concise, appealing way.
Displaying Data
Has your company conducted surveys or polls that you want to share? Or perhaps there is compelling data from your industry that you think would be valuable for your target audience to know. There is no better way to display this than through infographics. Charts and graphs are nothing new. But combining them with text and beautiful imagery can turn that data into a stunning and educational infographic.
This is a great infographic about data on the internet. The combination of color and visuals makes this content far more interesting than a list or simple spreadsheet
Comparing Things
Don’t just tell your customers how you differentiate from your competition, but show them! A well used infographic can easily show your audience the benefits of your company versus all the rest.
Here is a great infographic showing the differences between an internship at Google and Facebook. Way more compelling than a simple check list!
Key Benefits of Infographics
There is no doubt that infographics for business are beneficial for presenting information to your target audience and standing out from the crowd, but maybe you’re still dragging your feet on creating one. Here are some key benefits for why infographics should be a key part of your marketing strategy.
Grab Your Audience’s Attention
People love stats, statistics and facts that they can hold onto. By combining compelling information with stunning graphics, you can create incredibly eye-catching content.
Increase Comprehension of “What you Do”
The visual and text amalgam of infographics makes it way easier for your target audience to understand what it is that you “do”. This can be extremely beneficial in a complex industry, or in trying to differentiate yourself from competitors.
Increase Brand Awareness
Infographics should include your logo and website and potentially contact information. The shareability of this platform means more eyes on your content and your branding.
Increase Shareability and Traffic
Compelling infographics encourage readers to share and click. This will drive traffic to your website or blog, as well as generate additional interest through social shares!
Search Engine Optimization
Infographics encourage shares and links to your page, which creates important backlinks to your website. This surge of inbound links creates a super boost to your web search rankings.
I hope this blog has shown the importance of infographics and why you should use them in your business. Stay tuned for a follow-up post on how to create infographics for business.